- Category
- Data & Analytics
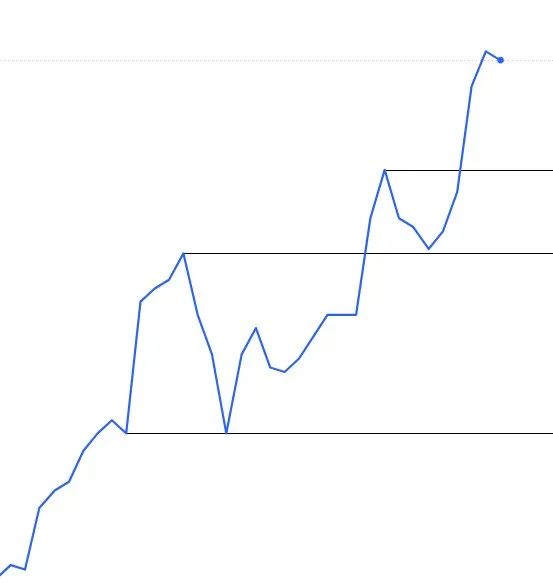
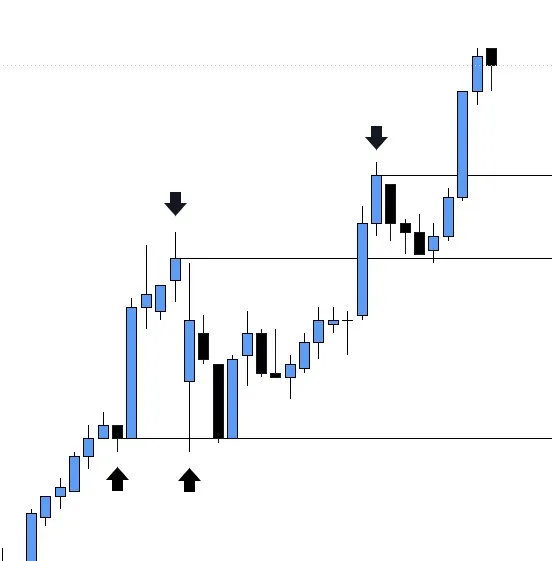
Mark Support and Resistance on a Line Chart
Identify support and resistance by marking horizontal levels at price turning points on a line chart, with the limitations of closing-price data in mind.
By Threads — Published on
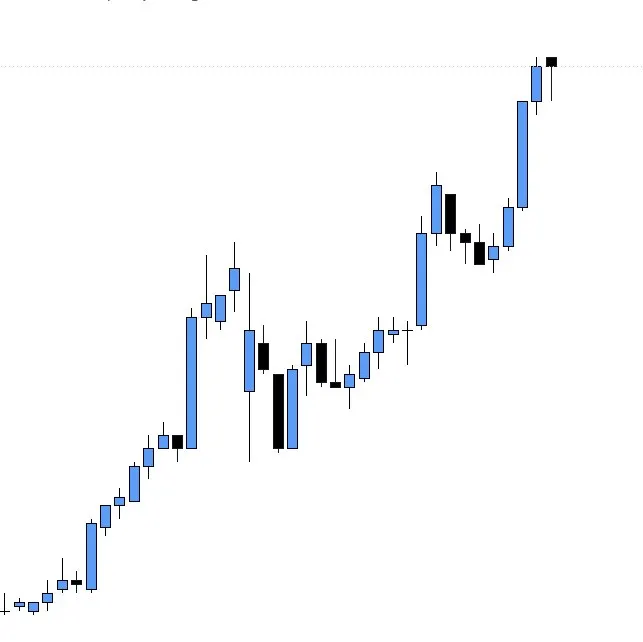
Example images
Prompt template
- Format
- Text
- Inputs
- Price_chart (image) · Required
- Outputs
- Annotated_chart (image)
Using the provided price chart, switch the view from candlesticks to a line chart. Identify the points where price begins a significant rise or decline, then mark horizontal support and resistance lines at those turning points. Base the markings on closing prices only: line charts omit opening prices and candle wicks, and may not show gaps. Treat the result as a limited guide rather than relying on these markings alone.
Comments — 0