
Interactive First-Half Sales Dashboard
Create an interactive dashboard that presents an overview of sales for a selected reporting period, using a sales CSV as its source. The default period is the first half of 2026
Interpret data, compare performance, and communicate findings through clear summaries and charts
Create an interactive dashboard that presents an overview of sales for a selected reporting period, using a sales CSV as its source. The default period is the first half of 2026
Analyze test results to identify topics where students are struggling, compare performance across topics, and suggest three remedial activities
Diagnose a YouTube channel’s monetization bottleneck using its last 14 days of impressions, CTR, average view duration, and net subscriber growth. Return a checklist addressing ...
Analyze the last 14 days of YouTube impressions, CTR, average view duration, and net subscriber growth. Diagnose a specific script-formatting defect, thumbnail-density bottlenec...
Create a recurring performance review system to identify successful content patterns and improve underperforming videos
Explain a company’s latest earnings report, covering performance against expectations, investor metrics, management guidance, and market reaction
Compare a stock’s valuation with peers and industry averages, estimate its value using discounted cash flow, and assess whether it appears under- or overvalued
Review a company’s financial performance over the last five years and assess whether its financial position is strengthening or weakening
Create a recurring analytics review system to identify strong content patterns and improve weaker videos. It covers reach, viewing behavior, subscriber conversion, traffic, enga...
Explore a business question using Excel, SQL, or Python. Review data quality, select relevant metrics, identify patterns, explain your findings, and finish with evidence-based i...
Estimate the interest savings and earlier debt-free date from adding a monthly payment to your highest-interest debt. Provide the balances, rates, minimum payments, and extra am...
Review three months of bank or credit card statements to identify recurring charges and potentially reducible or cancellable spending. The requested result groups expenses by ca...
Compare paying the smallest balance first with paying the highest-interest debt first. The prompt asks for payoff time and total interest estimates, followed by a recommendation...
Turn a list of debts into a clear overview of balances, minimum payments, and interest costs. Supply each debt's balance, interest rate, and minimum payment.
Turn presentation data into clear chart slides that build toward a main point.
Turn weekly figures into a clear report on performance and next priorities.
Measure agent outcomes, find recurring failure points and requests, then recommend three prioritized prompt changes grounded in the logs.
Score and order job opportunities using fit, compensation, growth, and missing-requirement criteria, explaining each score.
Combine audit findings into a ranked table of benefits, potential value, activation needs, limits, sources, and next actions.
Score and order job opportunities by fit, explaining each score across the specified criteria.
Turn each data finding into a concise takeaway and remove findings that would not affect the recommendation.
Rank five low-disruption spending changes by potential savings and effort.
Identify potentially reducible expenses and estimate their monthly and annual costs.
Categorize a month of spending and show where the largest amounts go, without judgment.
Investigate healthcare project data to uncover patterns, anomalies, missing information, and prioritized actions.
Compare contractor quotes for the same renovation project, identify scope gaps and contract risks, estimate likely extras, score each quote, and provide a budget check and negot...
Analyze household electricity and heating bills, identify likely sources of high costs, and recommend practical, costed improvements with a tracking plan.
Analyze statement lines for recurring charges, estimate monthly and yearly costs, prioritize actions according to the user's values, and return a savings plan as JSON.
Explain a SQL query in plain language for a spreadsheet-literate reader, including its business purpose, structure, filters, risks, and an executive summary.
Audit an e-commerce cart and checkout flow using Clarity recordings and configured auxiliary tools, then produce a prioritized evidence-based report.
Analyze a chart for scalping opportunities in the Indian crypto market, including buy and sell guidance, stop loss, and potential profit percentage.
Review a week's conversation logs for resolution rates, failure points, repeated requests, and prioritized prompt improvements.
Turn weekly numbers into a report showing what worked, what did not, and what to focus on next.
Find slides that would benefit from visuals, create charts or diagrams from the presentation's actual data, and suggest image searches where appropriate.

Generate and explain a Google Sheets formula that sums amounts by category for a specified month.
Compare the performance of ten recent posts, identify patterns in successful and unsuccessful posts, and suggest five follow-up topics.
Compare ten recent posts and their view counts to identify patterns in successful and underperforming posts, then recommend five topics to write next.
List document figures with what they measure and their sources, and flag numbers that do not add up.
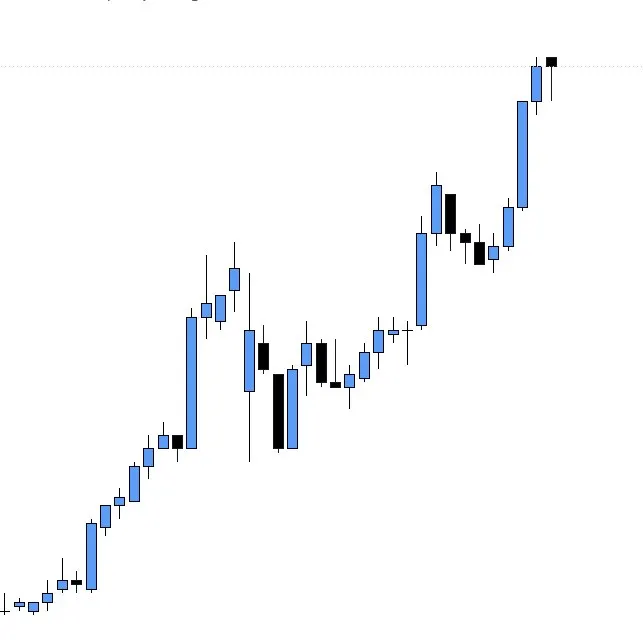
Identify support and resistance by marking horizontal levels at price turning points on a line chart, with the limitations of closing-price data in mind.
Organize supplied data into a professional .xlsx workbook with working formulas, tables, metrics, and charts.