Mark Support and Resistance on a Line Chart
Identify support and resistance by marking horizontal levels at price turning points on a line chart, with the limitations of closing-price data in mind.
Example outputs
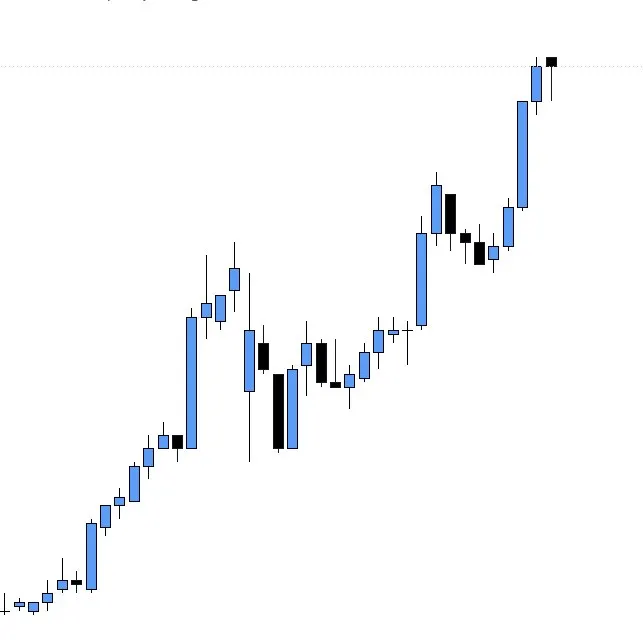
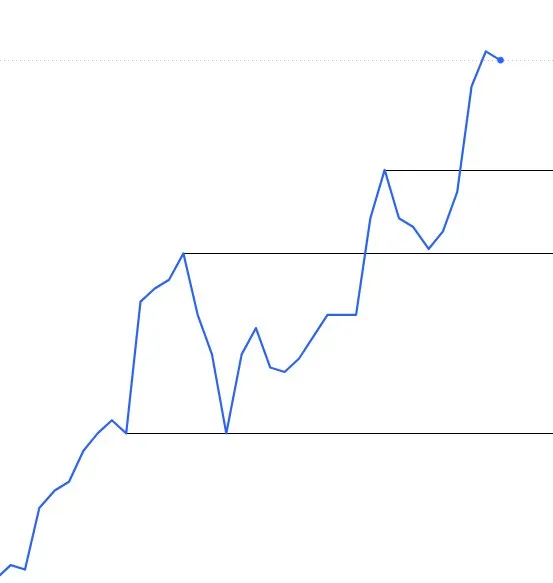
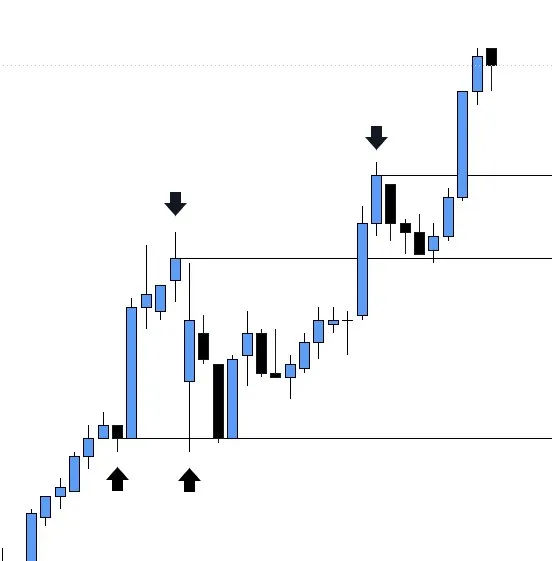
Prompt template
- Format
- Text
- Inputs
- Price_chart (image) · Required
- Outputs
- Annotated_chart (image)
Using the provided price chart, switch the view from candlesticks to a line chart. Identify the points where price begins a significant rise or decline, then mark horizontal support and resistance lines at those turning points. Base the markings on closing prices only: line charts omit opening prices and candle wicks, and may not show gaps. Treat the result as a limited guide rather than relying on these markings alone.What you'll create
A chart-focused output replaces candles with a line and places horizontal levels where significant rises or declines begin, treating them as a limited guide.
Frequently asked questions
Are candle wicks used for the levels?
No. The markings are based only on closing prices.
Comments
Tried this prompt? Share what you made, compare results, or ask a question