Stock Screening, Price-Pattern Analysis, and Insider Activity
Analyze recent OHLCV trends for a stock, investigate related corporate actions, identify similar fall-and-rebound candidates, review insider transactions, and create a visual summary.
Example outputs
Prompt template
- Format
- Text Parameterized
- Inputs
- primary_ticker (text) · Optional · Default: INET related_ticker (text) · Optional · Default: PADA follow_up_ticker (text) · Optional · Default: TOWR lookback_period (text) · Optional · Default: 3 months
- Outputs
- StockResearchReport (text) VisualSummary (image)
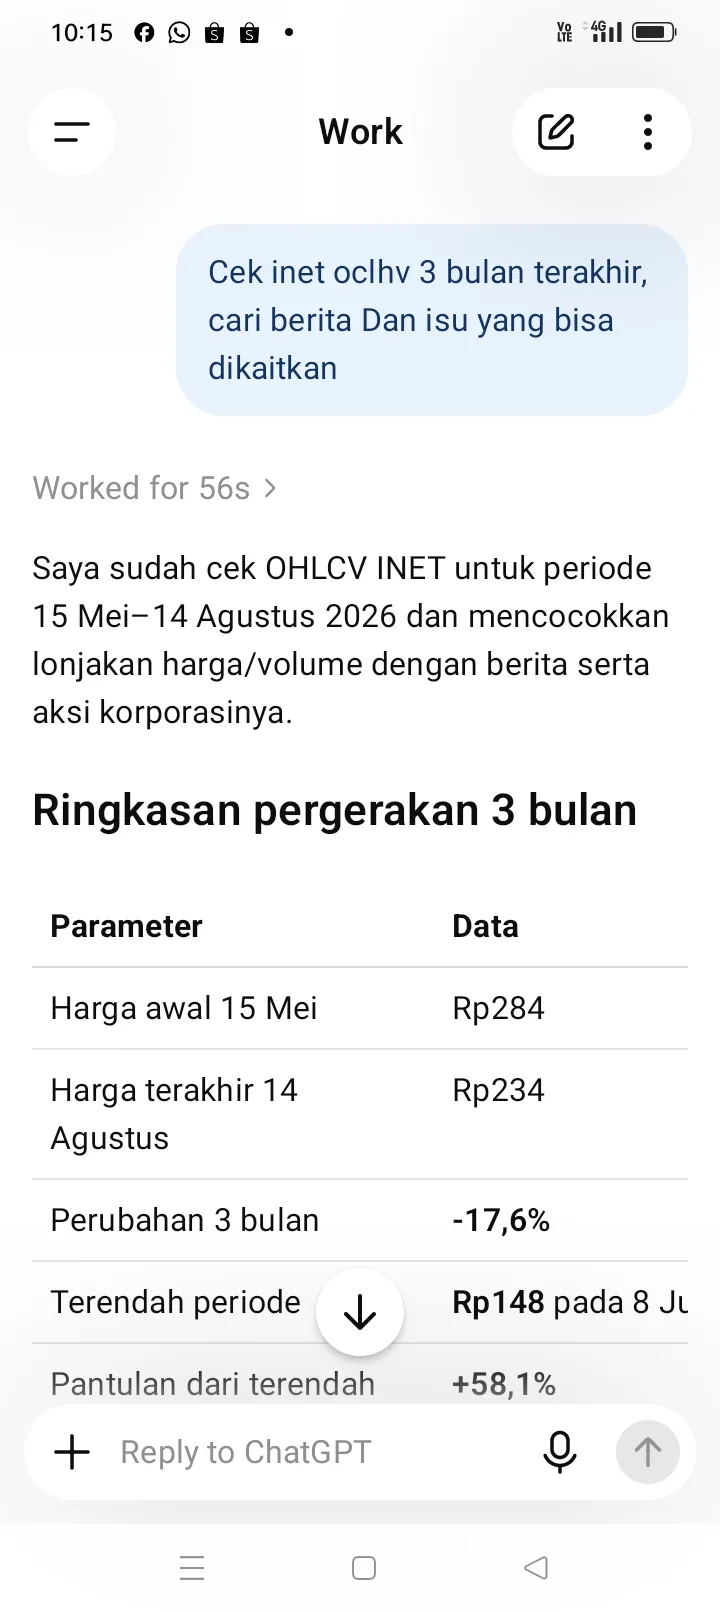
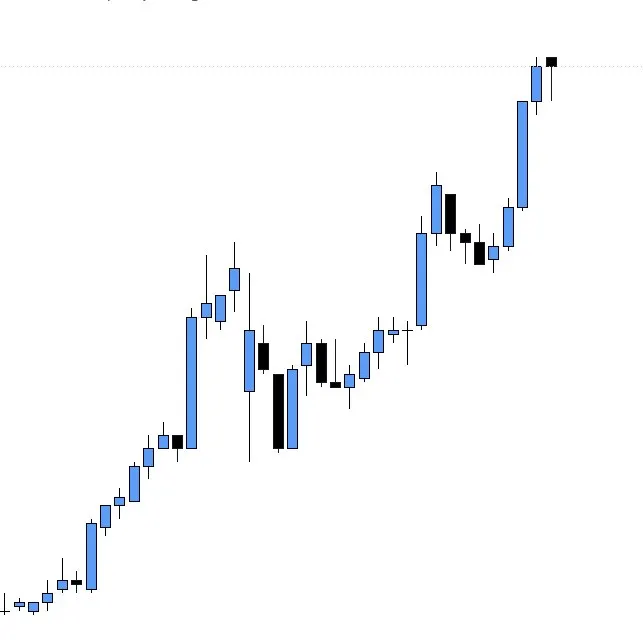
Analyze ${primary-ticker:INET} using OHLCV data for the last ${lookback-period:3 months}. Summarize its price movement, identify important phases in the period, and explain how the current price compares with that history.

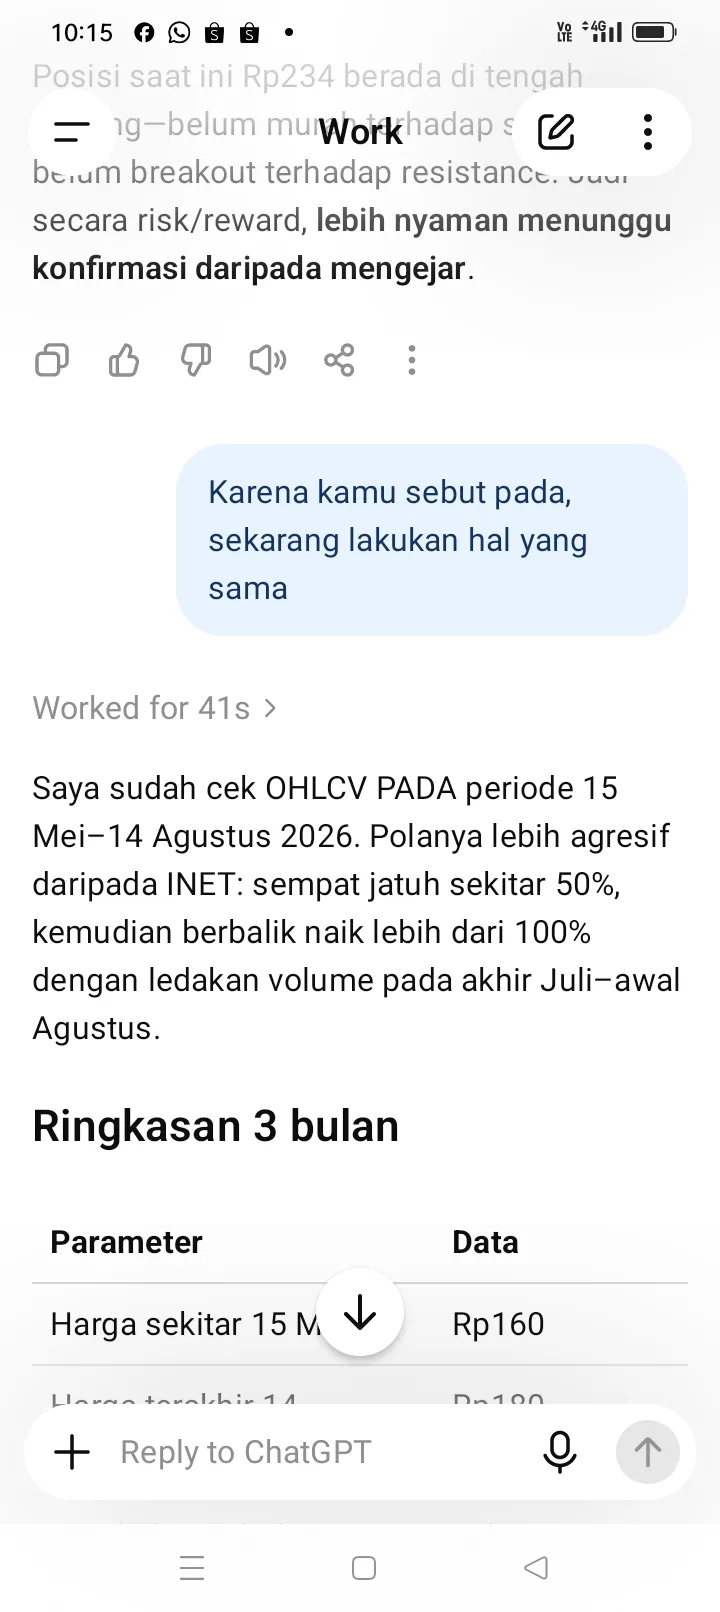
Investigate any relevant corporate action involving ${related-ticker:PADA}, including the reported acquisition and its potential connections to the primary stock’s business or price movement. Compare the two stocks’ OHLCV patterns over the same period and explain any similarities or differences.

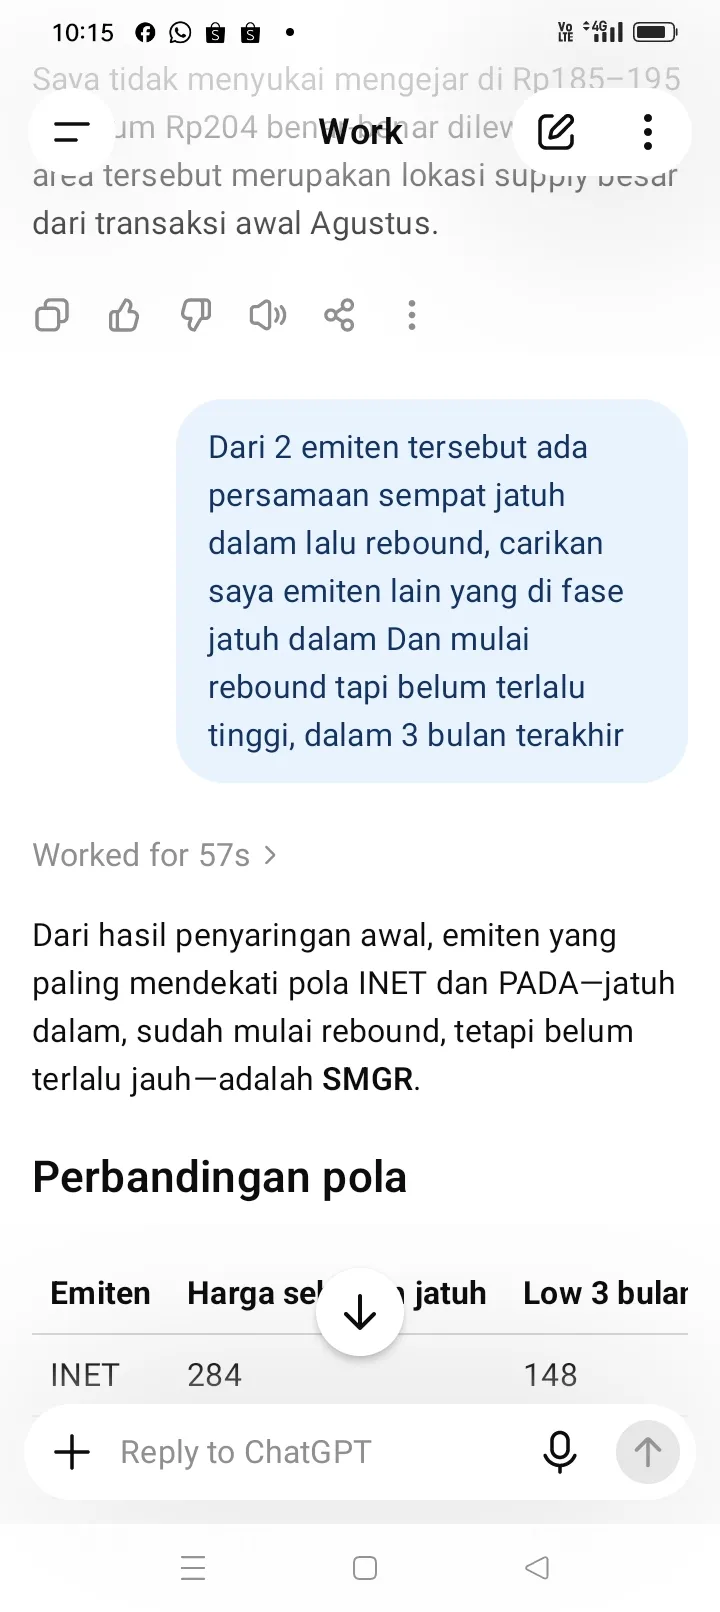
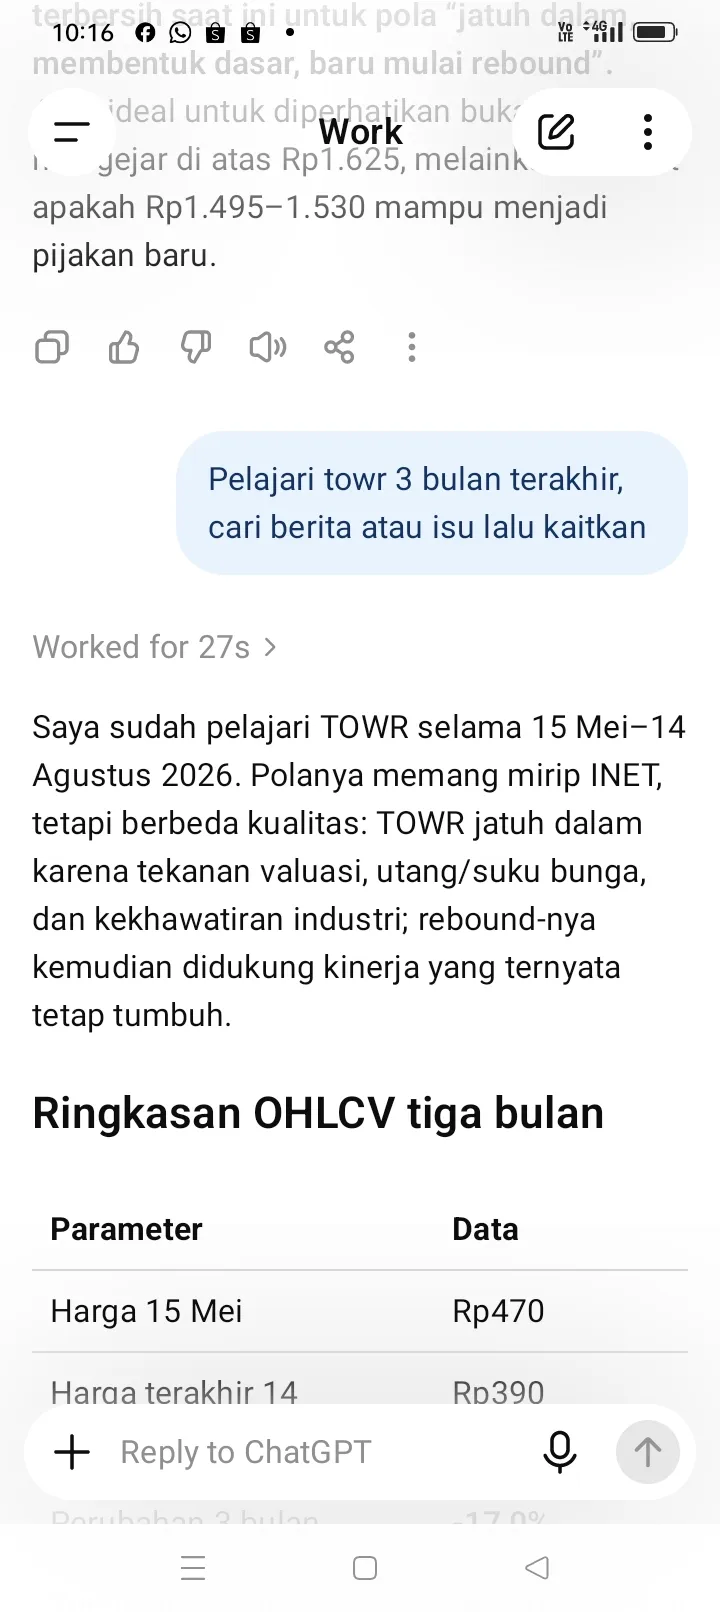
Find other stocks with a similar decline-and-rebound pattern. List and compare the strongest candidates, including the extent of each rebound and how closely its price movement resembles the primary stock. Then analyze ${follow-up-ticker:TOWR} in more detail using the same OHLCV lookback.

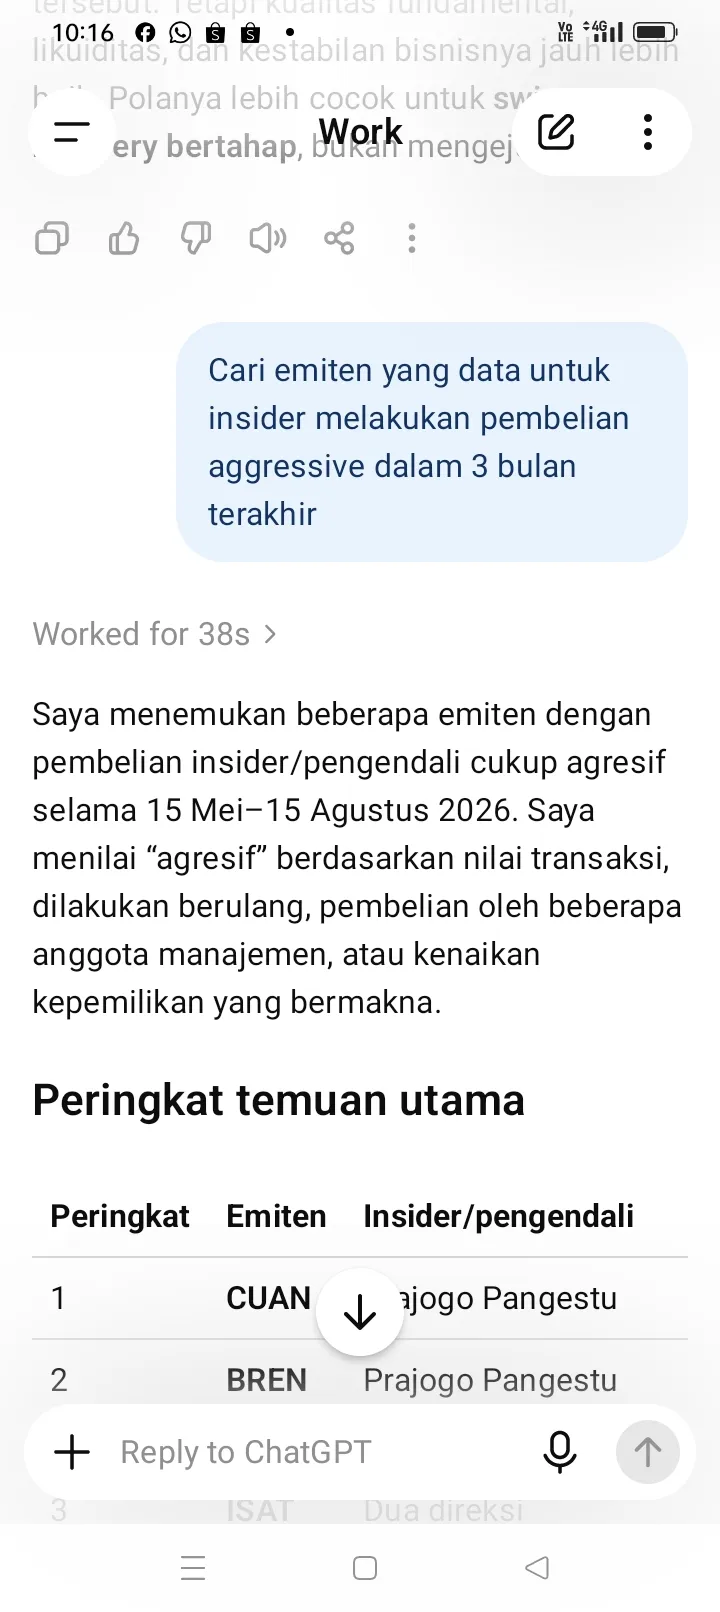
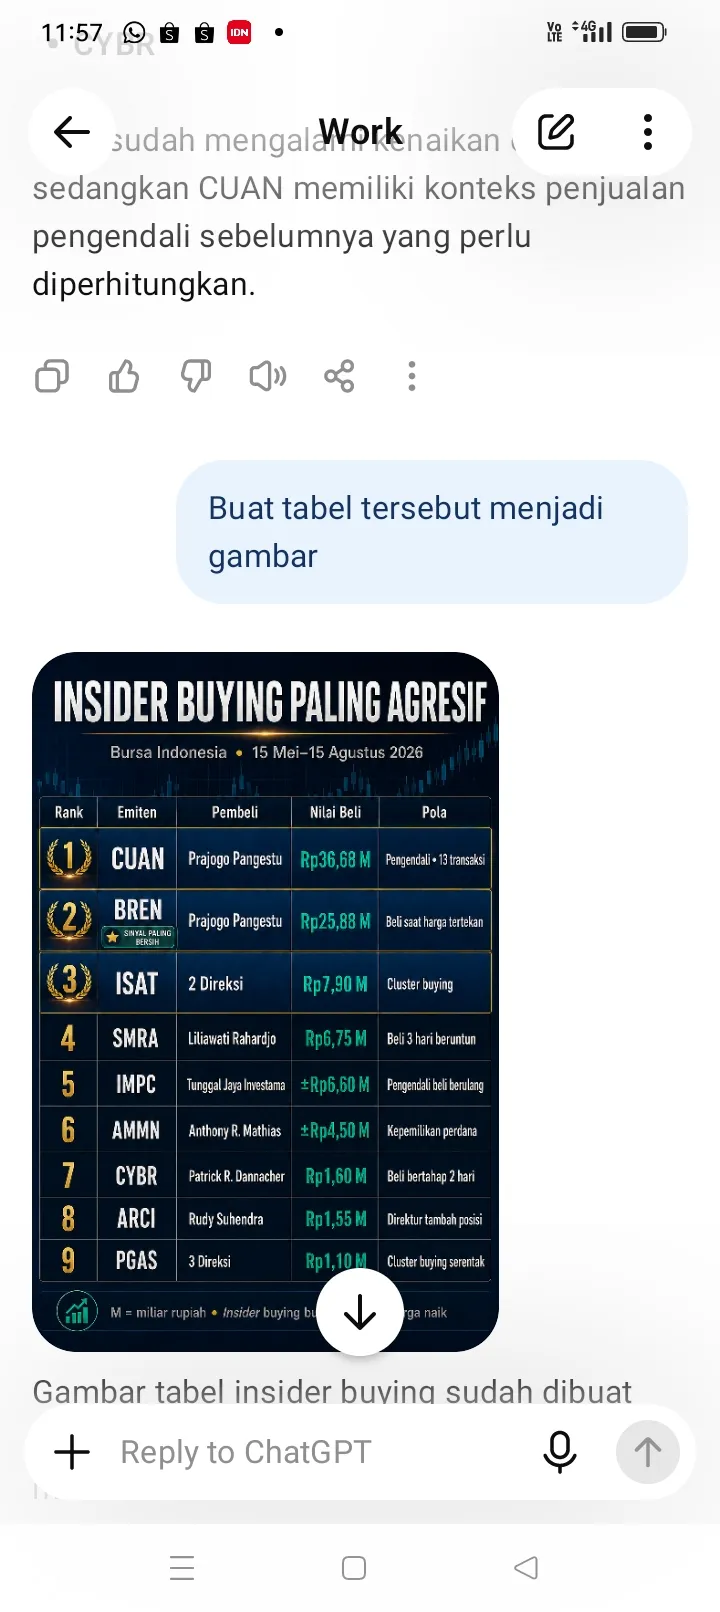
Screen for insider buying and selling over the same period. Name the relevant companies and buyers or sellers, report transaction values where available, and summarize notable patterns.

Present the analysis as a practical watchlist and technical trading-planning aid. Finish with a clear visual summary of the findings.
Replace the ${…} placeholders with your values
before using this prompt. See parameters
and defaults below
Parameters
Replace each placeholder with your own value, or use its default when one is provided
${primary-ticker:INET}
primary-ticker
Default: INET
${lookback-period:3 months}
lookback-period
Default: 3 months
${related-ticker:PADA}
related-ticker
Default: PADA
${follow-up-ticker:TOWR}
follow-up-ticker
Default: TOWR
What you'll create
An OHLCV-based analysis tracks a primary stock, compares related patterns and builds a practical watchlist with insider transaction context.
Frequently asked questions
Is the analysis limited to the primary ticker?
No, it also compares related and follow-up stocks and searches for similar patterns.


Comments
Tried this prompt? Share what you made, compare results, or ask a question