Interactive First-Half Sales Dashboard
Create an interactive dashboard that presents an overview of sales for a selected reporting period, using a sales CSV as its source. The default period is the first half of 2026
Example outputs
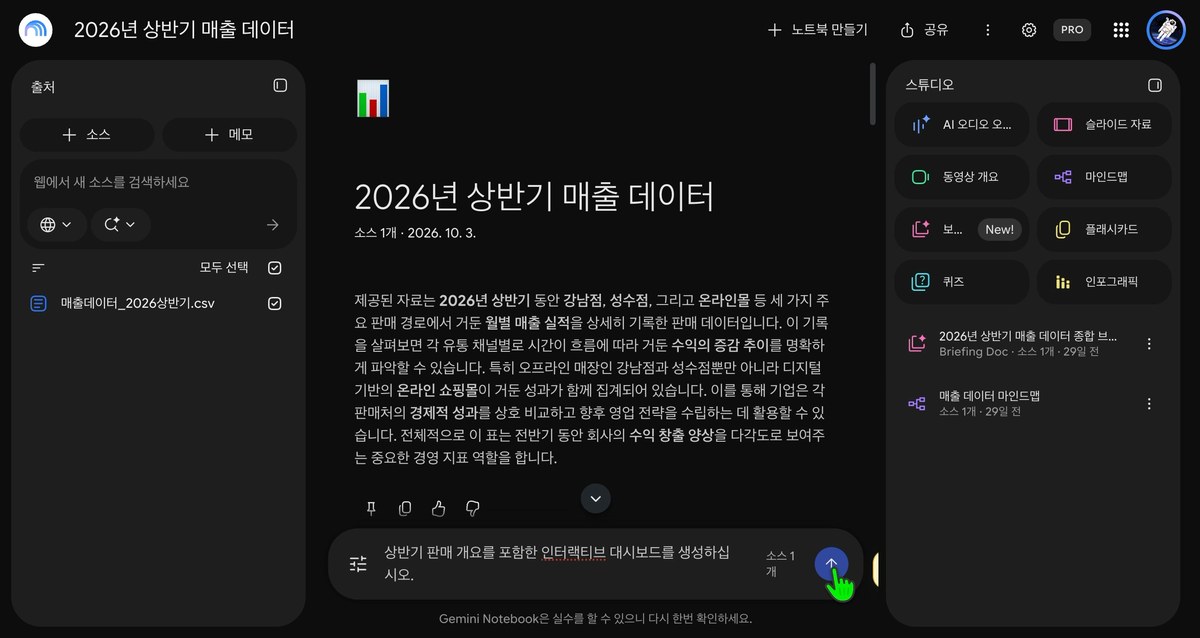
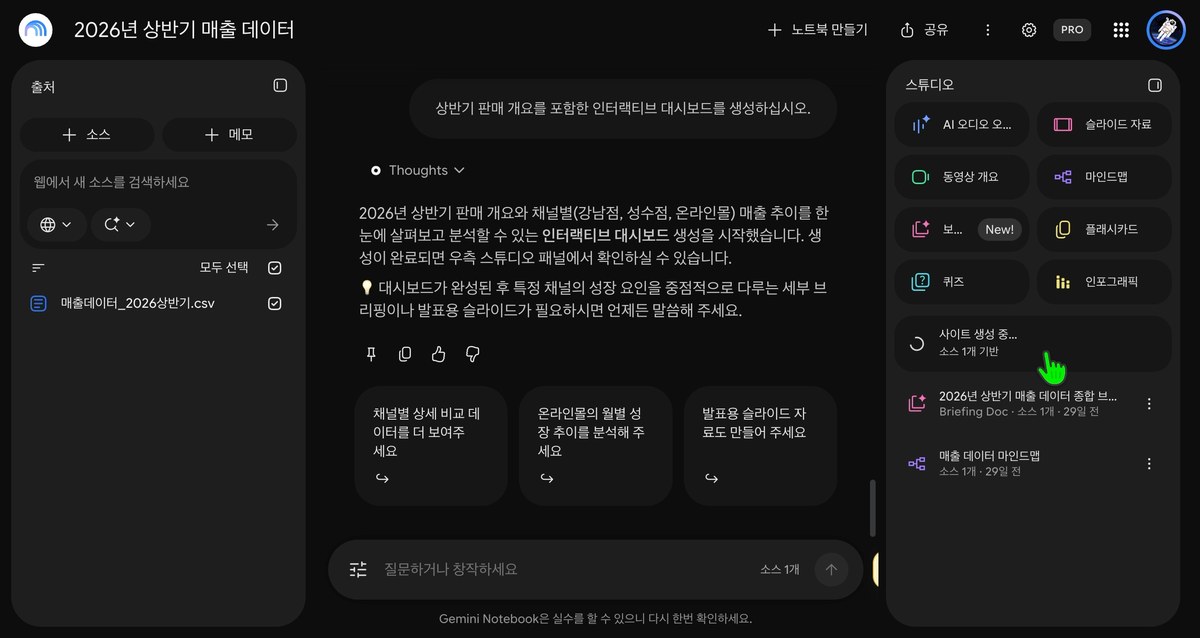
Prompt template
- Format
- Text Parameterized
- Inputs
- SalesCSV (csv) · Required sales_period (text) · Optional · Default: the first half of 2026
- Outputs
- InteractiveDashboard (html)
Using the provided sales CSV, create an interactive dashboard with an overview of ${sales-period:the first half of 2026} sales.Replace the ${…} placeholders with your values
before using this prompt. See parameters
and defaults below
Parameters
Replace each placeholder with your own value, or use its default when one is provided
${sales-period:the first half of 2026}
sales-period
Default: the first half of 2026
What you'll create
This prompt asks for an interactive dashboard summarizing sales data from a CSV. Its reporting period defaults to the first half of 2026
Usage instructions
Provide the sales CSV as the source data for the dashboard. Change the reporting-period placeholder if you want to summarize a different period
Comments
Tried this prompt? Share what you made, compare results, or ask a question