Professional Topic Infographic
Create a readable, professionally structured infographic about a supplied topic.
Prompt template
- Format
- Text Parameterized
- Inputs
- topic (text) · Required
- Outputs
- infographic (image)
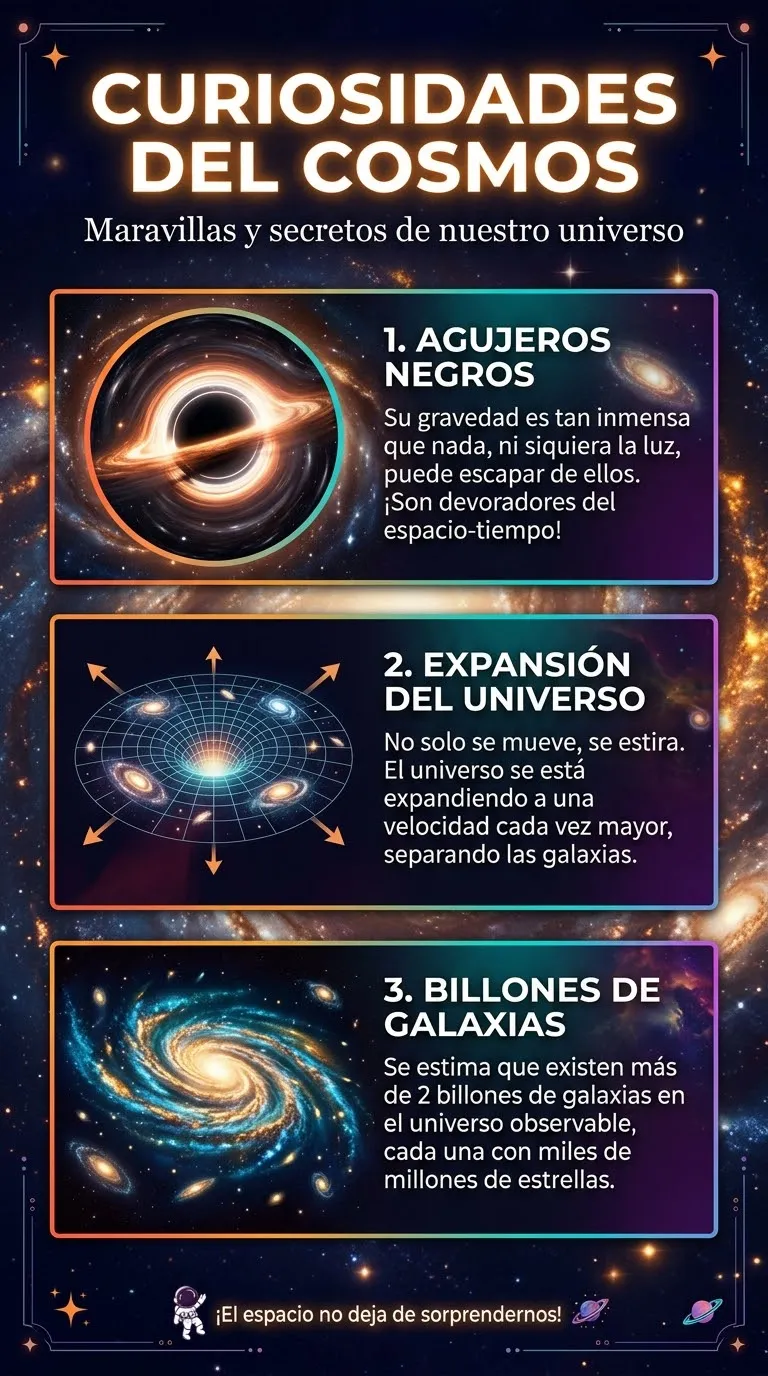
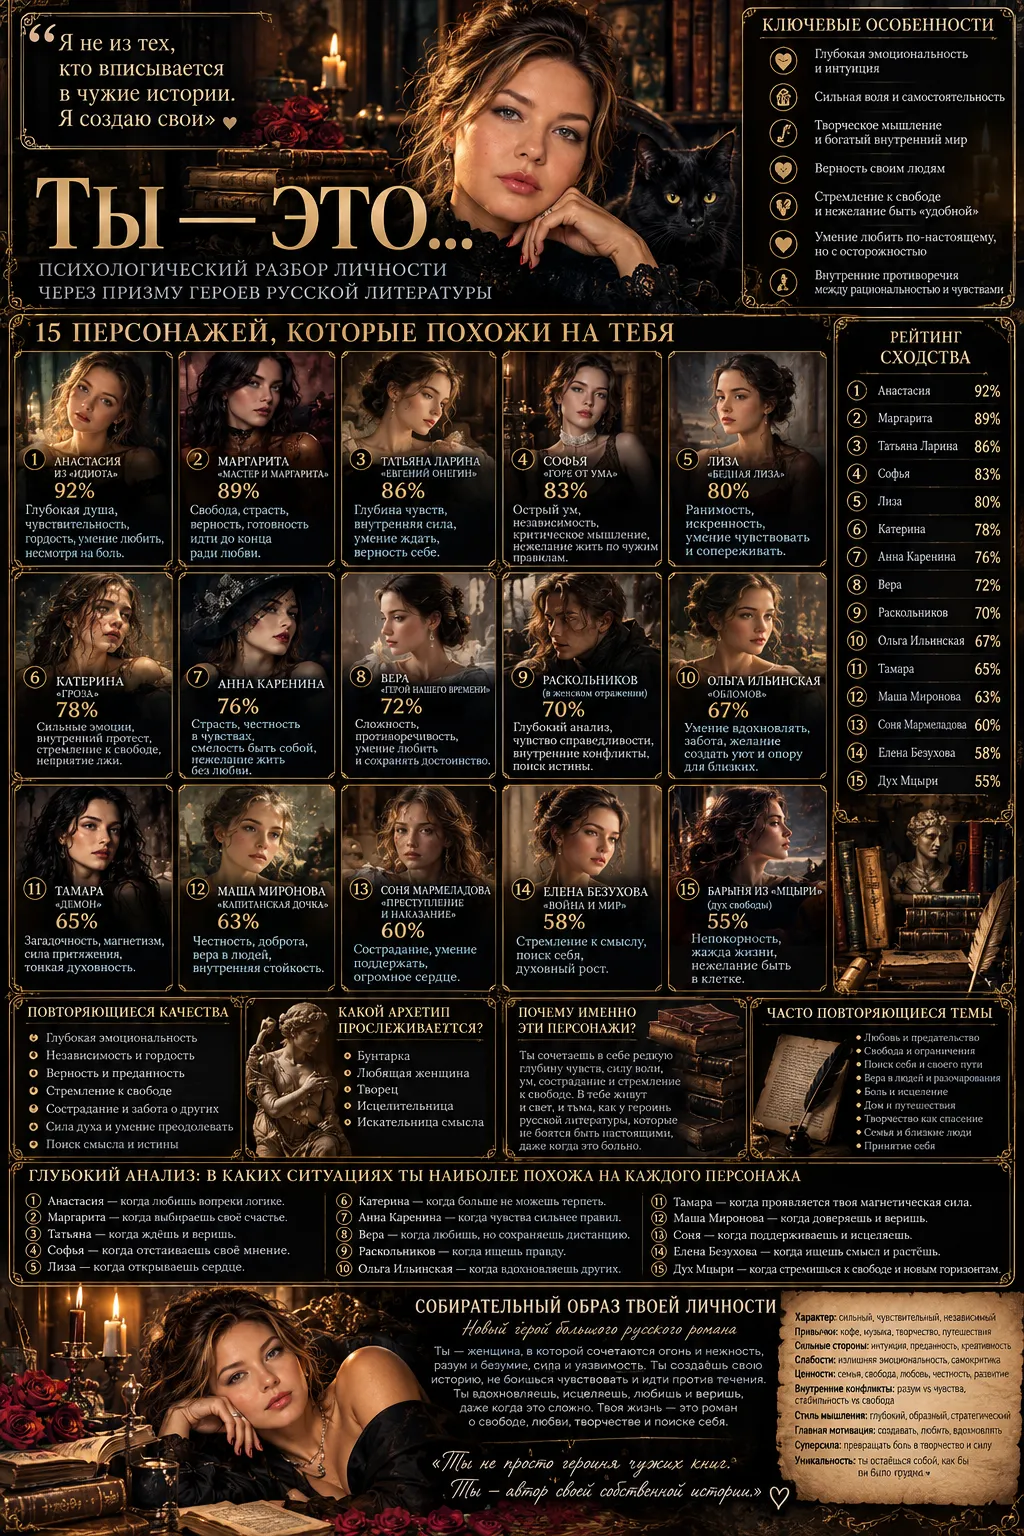
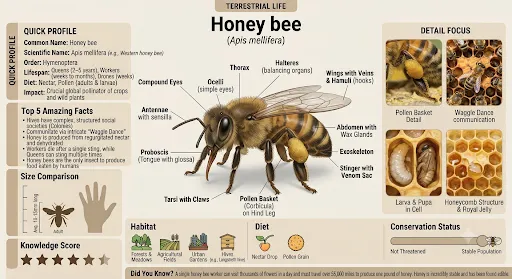
Create a professional 1080 × 1350 infographic explaining ${topic}. Use a strict grid, clearly divided sections, consistent spacing, and strong visual hierarchy. Use charts or icons only when they genuinely help explain the information. Make the infographic easy to scan. Avoid rainbow colors, excessive arrows, tiny fonts, and fabricated data.Replace the ${…} placeholders with your values
before using this prompt. See parameters
and defaults below
Parameters
Replace each placeholder with your own value, or use its default when one is provided
${topic}
topic
Required
What you'll create
A disciplined grid organizes the topic into clear readable blocks. Charts or icons appear only when they help explain the content, with strong type hierarchy and generous spacing.
Frequently asked questions
Can statistics be invented for visual impact?
No, fabricated data is excluded.
What size is requested?
The infographic is 1080 × 1350 pixels.



Comments
Tried this prompt? Share what you made, compare results, or ask a question