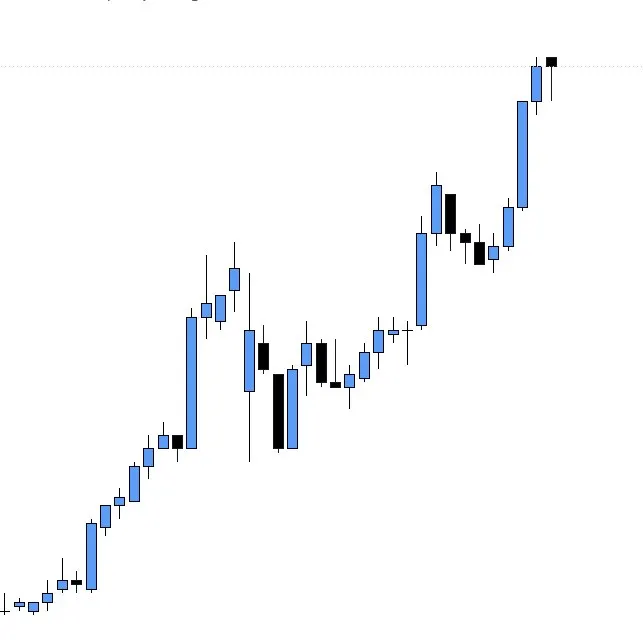
Mark Support and Resistance on a Line Chart
Identify support and resistance by marking horizontal levels at price turning points on a line chart, with the limitations of closing-price data in mind.
Technical Analysis prompts involve interpreting charts and market information, including price levels, trends, and related activity. Use them to organize an analysis or visual summary, specify the data and time frame, and ask for limitations and assumptions to be made clear
Identify support and resistance by marking horizontal levels at price turning points on a line chart, with the limitations of closing-price data in mind.
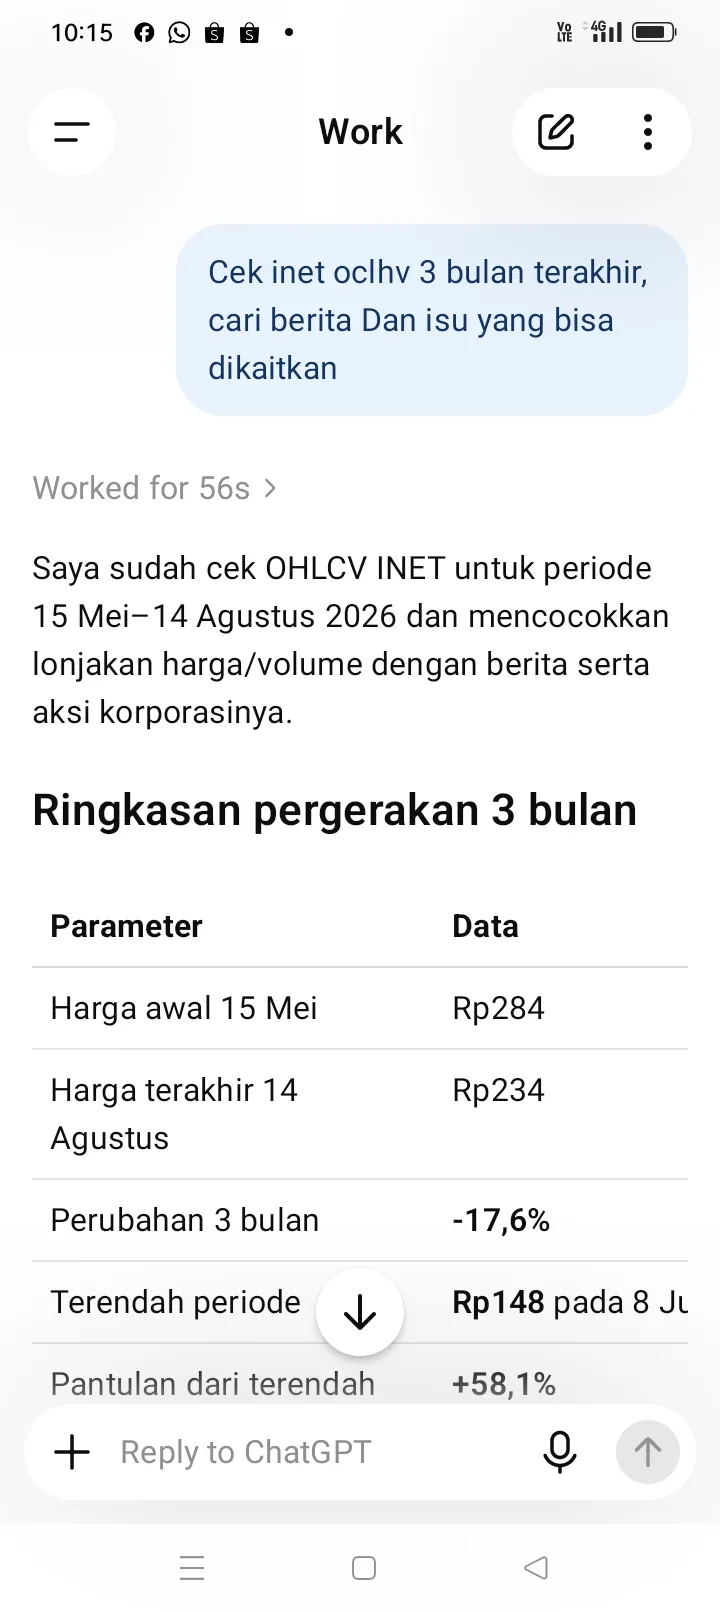
Analyze recent OHLCV trends for a stock, investigate related corporate actions, identify similar fall-and-rebound candidates, review insider transactions, and create a visual summary.
this setup for leverange x5 need screenshot time frame 4H 1H 15M 5M FUVCK FOR COPY AND FOR SALE THIS PROMPT
